before anything else
I spent summer 2025 in the Sempionatto Lab at Rice working on what was, on paper, a single project: build a wearable biosensor that can track glucose and other biomarkers in sweat continuously, and feed that data into a model that predicts blood glucose accurately enough to one day close the loop on insulin delivery.
What it actually was, in practice, was three projects taped together: wet electrochemistry at a lab bench, mixed-signal PCB design at a screen, and machine learning on a publicly available diabetes dataset. I did pieces of all three and spent the summer fumbling between them. This is the writeup.
Co-authored with my PIs Dr. Juliane Sempionatto and Dr. Beatriz Mayol. Sponsored by OURI (Rice's Office of Undergraduate Research and Inquiry).
the problem
Diabetes mellitus affects roughly 830 million people. The standard of care is finger-prick blood glucose tests several times a day plus, for the people who can afford it, a continuous glucose monitor with a subcutaneous needle that gets replaced every 7 to 14 days. Insulin dosing is a separate device, separate needles, and largely a separate decision: the closed loop (sensor reads blood glucose, predicts a trajectory, doses insulin automatically) exists in research and in a few high-end commercial systems but it is invasive, fragile, and expensive.
The pitch of this project is that sweat carries the same biomarkers that blood does, just at lower concentrations and with a calibration offset. If you can read sweat reliably and learn the per-person mapping from sweat to blood, you can build the same closed loop without ever breaking the skin.
what we built
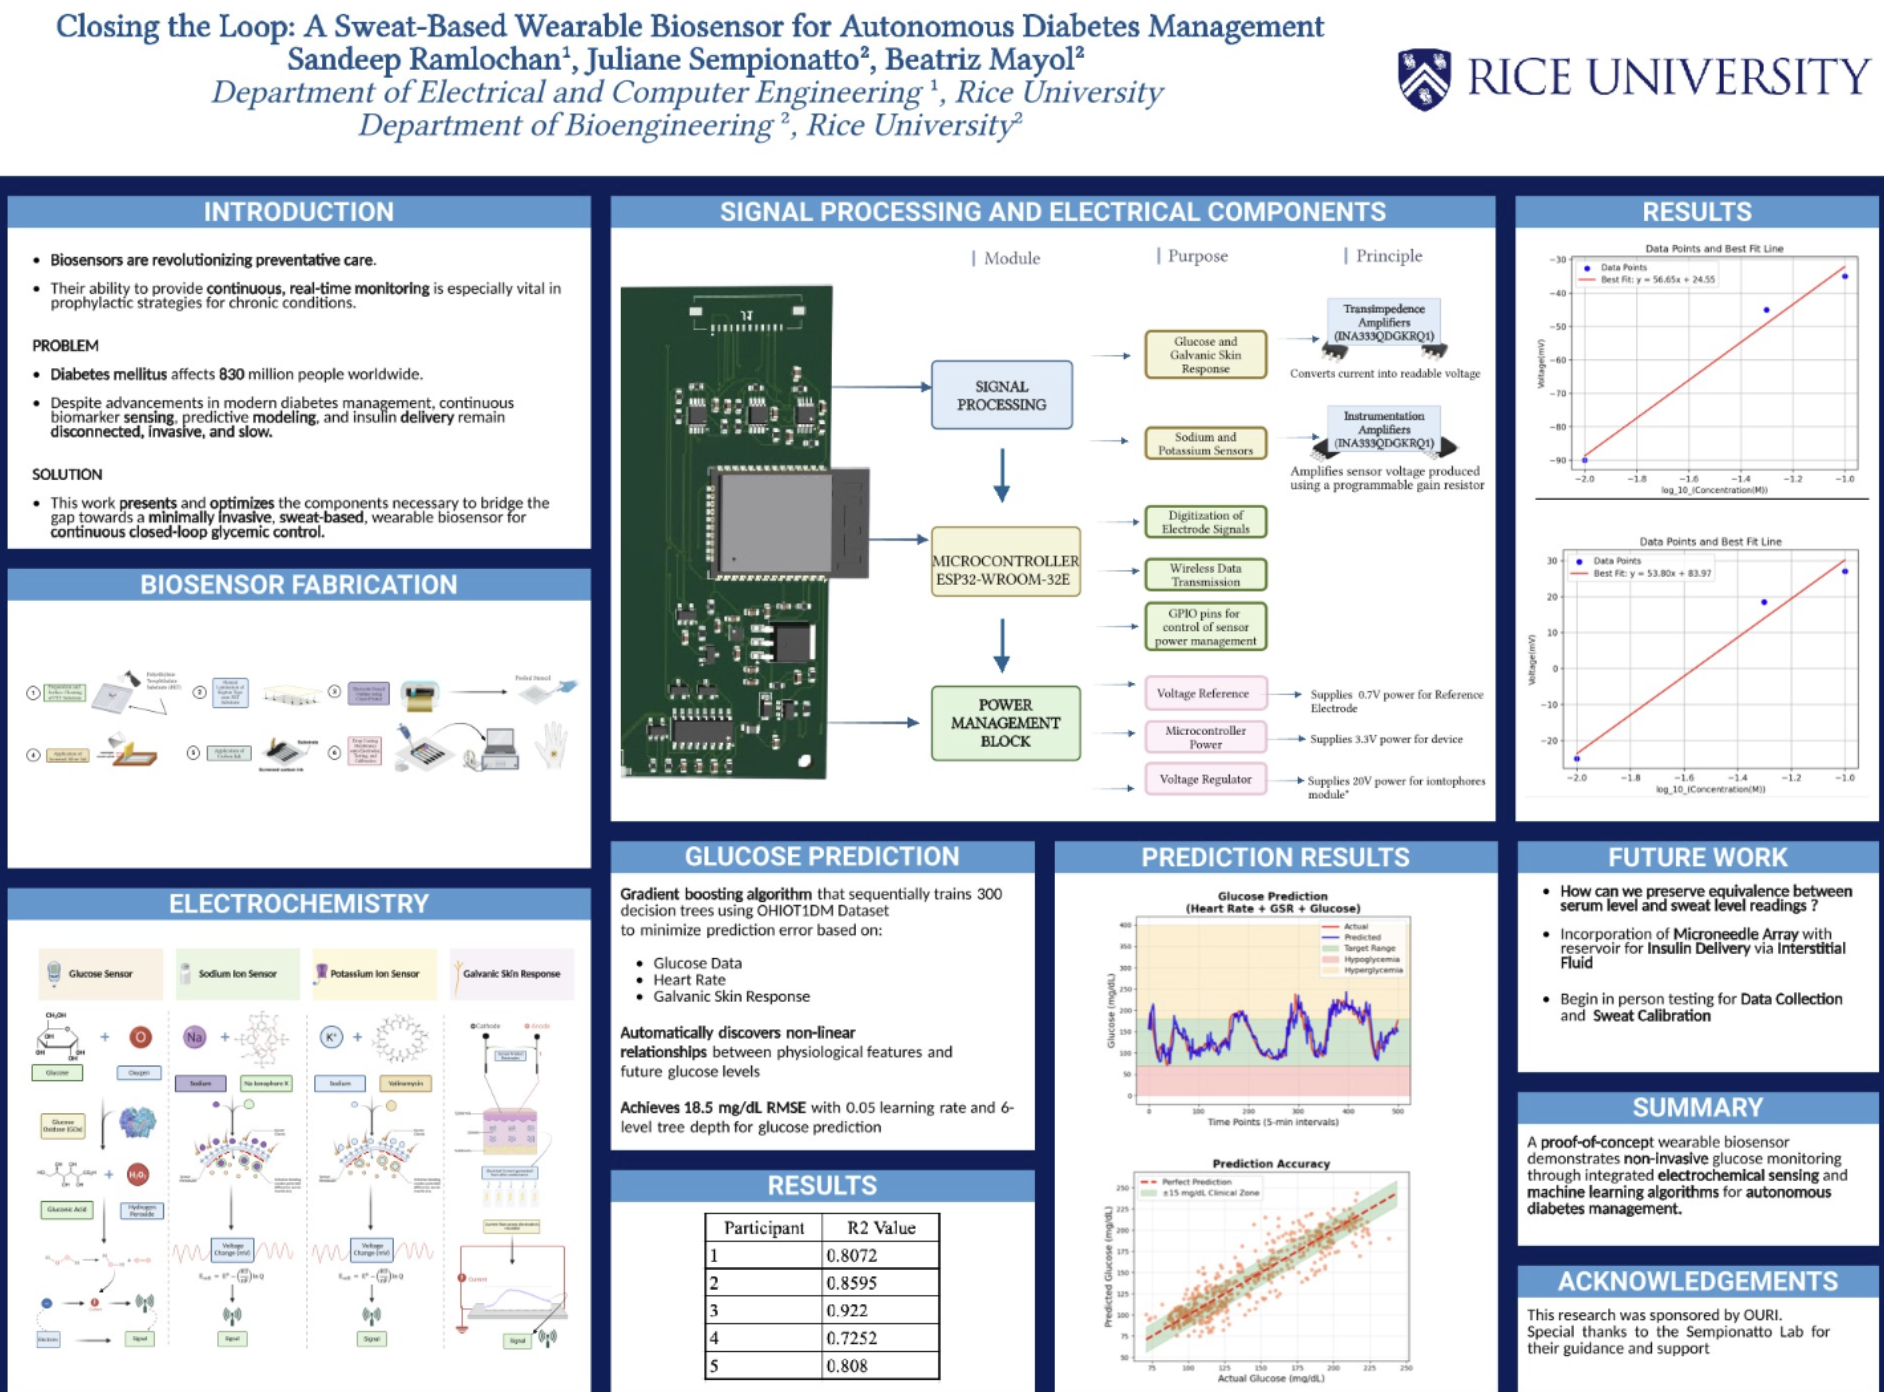
A wearable, skin-contact patch with four electrochemical sensors and a small analog frontend that streams data to a phone over BLE. On top of that, a gradient-boosted regression model that takes the sensor stream and predicts blood glucose 30 minutes out, trained on the OhioT1DM open dataset.
The full system has three layers and they all have to work together:
- Electrochemistry. Four sensors fabricated by hand: glucose, sodium, potassium, and galvanic skin response.
- Electronics. A multi-layer PCB carrying an ESP32-WROOM-32E, the analog frontends for each sensor, a 3-rail power tree, and an iontophoresis driver to actually pull sweat out of the skin on command.
- Machine learning. A gradient boosting model that fuses the sensor channels with heart rate and learns the non-linear sweat-to-blood mapping per participant.
the poster
biosensor fabrication
The first half of the summer I was a lab person, not an electronics person. That was a real adjustment. The sensors get built up on a flexible substrate one layer at a time: clean the surface, deposit a polylactic acid base, drop-cast the working enzyme or ion-selective membrane, dry, cure, calibrate. Most of those steps involve waiting. The actual hands-on touches are 30 seconds long; the steps between them are 30 minutes each.
The four sensors share a fabrication backbone but each has a different chemistry on top of the working electrode:
- Glucose sensor. Glucose oxidase enzyme on a Prussian blue mediator layer. Glucose gets oxidized into gluconic acid and hydrogen peroxide. The peroxide reduces at the electrode and produces a current proportional to the glucose concentration. This is the entire field of "amperometric glucose sensing" in one paragraph.
- Sodium & potassium sensors. Ion-selective membranes (sodium ionophore X for Na⁺, valinomycin for K⁺) on top of a conductive layer. These are potentiometric: instead of producing a current, the electrode sits at a voltage that's a logarithmic function of the ion concentration in solution. Nernst equation, basically.
- Galvanic skin response. Two electrodes measure how well a small AC excitation propagates through the skin between them. Sweat is conductive; dry skin is not. GSR doubles as a proxy for sympathetic nervous activity (stress, exertion).
The two failure modes I lost the most time to: dropcasts that didn't dry uniformly (rings, coffee-stain effect) and membranes that delaminated when the substrate flexed. Both are solved by patience and by using less liquid than your intuition tells you to.
signal processing & the PCB
The four sensors produce very different signals. The glucose and GSR channels are current-mode: hundreds of nanoamps at the working electrode, which has to be turned into a voltage we can sample. The sodium and potassium channels are voltage-mode: tens of millivolts that have to be amplified without injecting bias current that would pull the floating ion-selective electrode off its setpoint.
The analog frontend is built around two roles for the INA333 instrumentation amp:
- Transimpedance amplifiers for the glucose and GSR channels. Convert nA-scale current into a clean voltage swing.
- Programmable-gain instrumentation amplifiers for the sodium and potassium channels. Pick up the millivolt signal from the ISE without loading it.
Everything feeds the ESP32-WROOM-32E's 12-bit ADCs. The ESP also drives BLE for streaming, handles the GPIO that enables and disables each sensor's bias chain (so we're not burning current on a channel we aren't reading), and toggles the iontophoresis driver that briefly pushes a 20 V iontophoretic pulse across the skin to induce sweat production on demand.
Power management was its own little sub-project. Three rails: 0.7 V reference for the sensor common, 3.3 V for the ESP and the analog frontend, and a separate 20 V boost rail for the iontophoresis pulse. The 20 V rail only fires for a few seconds at a time, but it has to be cleanly isolated from the 3.3 V analog domain or the ADC readings turn into garbage every time it kicks on.
calibration
The first thing you do with any new sensor is calibrate it against known concentrations and check that the response is linear (or log-linear, for the ISEs). For both ion-selective channels we plotted measured voltage against log₁₀(concentration) and fit a line. We expected Nernstian behavior, which would give a slope of around 59 mV/decade at room temperature for a monovalent ion. What we actually got was within shouting distance of that:
- Channel 1: y = 56.65·x + 24.55
- Channel 2: y = 53.80·x + 83.97
Both close enough to Nernstian that we trusted the chemistry. The intercept differences between the two channels are mostly about the reference electrode and the membrane lot.
predicting blood glucose
Reading sweat is one thing; predicting blood glucose from sweat is another. Sweat glucose is roughly correlated with blood glucose but lags by a few minutes, is concentration-shifted, and varies with sweat rate and skin temperature. You need a model.
We used gradient boosting on the OhioT1DM dataset, which has continuous glucose, heart rate, GSR, and dosing data for several Type 1 diabetes participants over a few weeks. The model sequentially trains 300 decision trees, each one correcting the residual error of the trees before it. The inputs are glucose history, heart rate, and GSR. The output is predicted glucose 30 minutes ahead. Hyperparameters that converged after some sweeping: learning_rate = 0.05, max_depth = 6, n_estimators = 300.
Across 5 participants we get:
Overall RMSE of 18.5 mg/dL. For context, clinical CGMs aim for somewhere in the 8 to 15 mg/dL range, so we're not at clinical accuracy yet, but we're in the same order of magnitude with sweat data instead of subcutaneous data. The Participant 4 dip is a real thing: that participant's data had the most exercise and the most variable sweat profile, and the model struggled with the higher-volatility regions.
what's next
- Sweat-to-serum calibration on real participants. The OhioT1DM dataset doesn't include sweat. The next step is to wear the patch alongside a commercial CGM and learn the per-person offset and time-lag.
- Microneedle array for closed-loop insulin delivery. A microneedle array on the back of the same patch, with a small insulin reservoir, lets us actually close the loop instead of just predicting glucose. The needles tap interstitial fluid, which is faster-equilibrating with blood than sweat is, and the same housing delivers insulin.
- Robustness. The patch needs to keep working through showers, sleep, and exercise without recalibration. Most of that is mechanical (adhesive, encapsulation) and electrochemical (membrane stability) rather than electrical.
what I actually learned
The thing I came in expecting to learn was PCB layout for a mixed-signal analog board. I did learn that, and the layout for this project is the most thoughtful one I've done so far. But the bigger lesson was something else.
I came in thinking the sensor would be the hard part and the model would be the easy part. It was the opposite. Building the sensors was slow but mechanical: do step 1, wait, do step 2, wait, check that the calibration curve is roughly Nernstian, move on. The model was where the real research happened. Choosing features, deciding what counts as a fair prediction window, picking which participants to leave out, deciding what "good enough" means clinically. Those are the actual hard questions, and they're the ones a paper or a deployed product lives or dies on.
The other thing I'll carry forward: every layer of this system was hard to debug in isolation. A weird ADC reading could be a bad solder joint, a bad membrane, a bad gain setting, a bad reference electrode, or honest physiology. Building this taught me that the most valuable thing on a research project is a clean way to isolate the layer you're testing. Most of the time I lost was spent debugging things at the wrong layer of the stack.
acknowledgements
Research sponsored by OURI. Enormous thanks to Dr. Juliane Sempionatto and Dr. Beatriz Mayol at the Sempionatto Lab for letting me into the lab, teaching me electrochemistry from scratch, and being patient with me through ten weeks of "is this supposed to look like this?"